

From an asset register to a living twin.
Here is the pipeline, shown on MineZero, our sandbox mine. Every piece below is running today. Nothing on this page is a concept render.
Start from the spreadsheet you already have
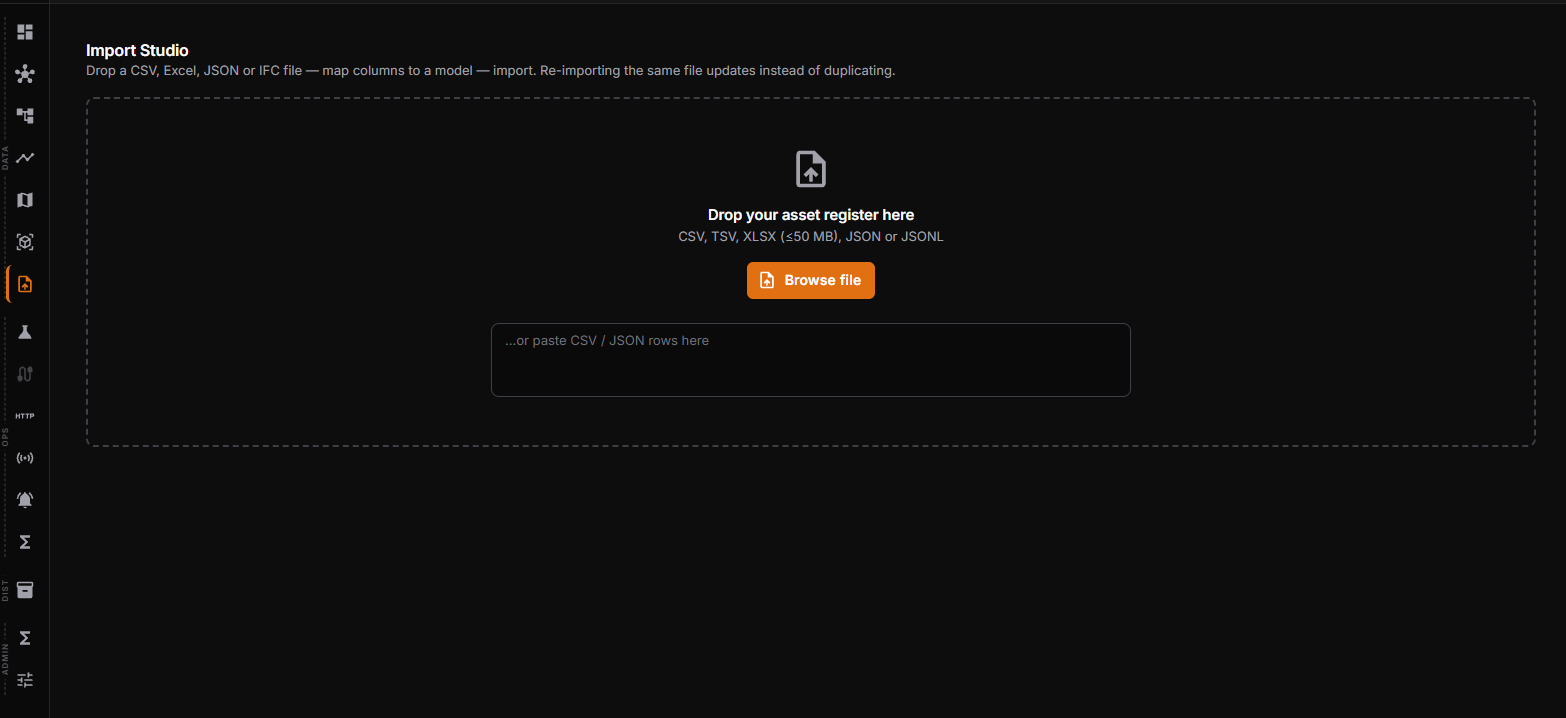
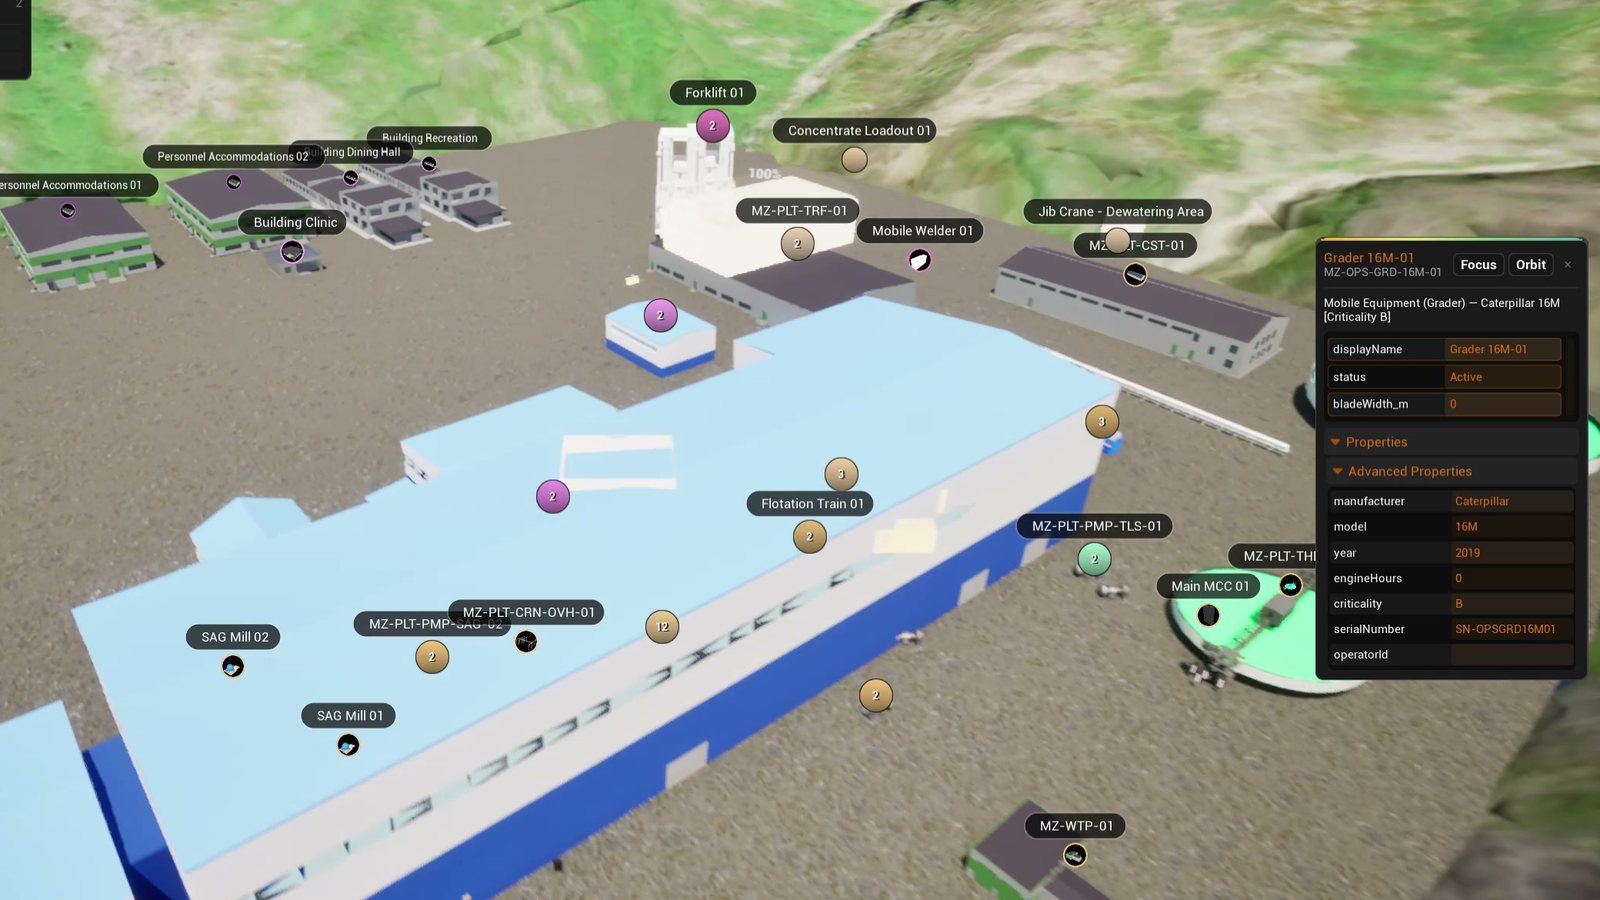
Import the asset register, map its columns to typed models, and every row becomes a twin with an identity, a class and a place. Terrain comes from satellite data. Drawings and the asset library fill in what the register does not describe.
- Typed models for equipment, plant, infrastructure, people and documents
- Placement on real terrain with map-click precision
- Roads, dig areas and dump areas drawn on the site and used by the simulator
- Simulation control to run a haul cycle before committing it
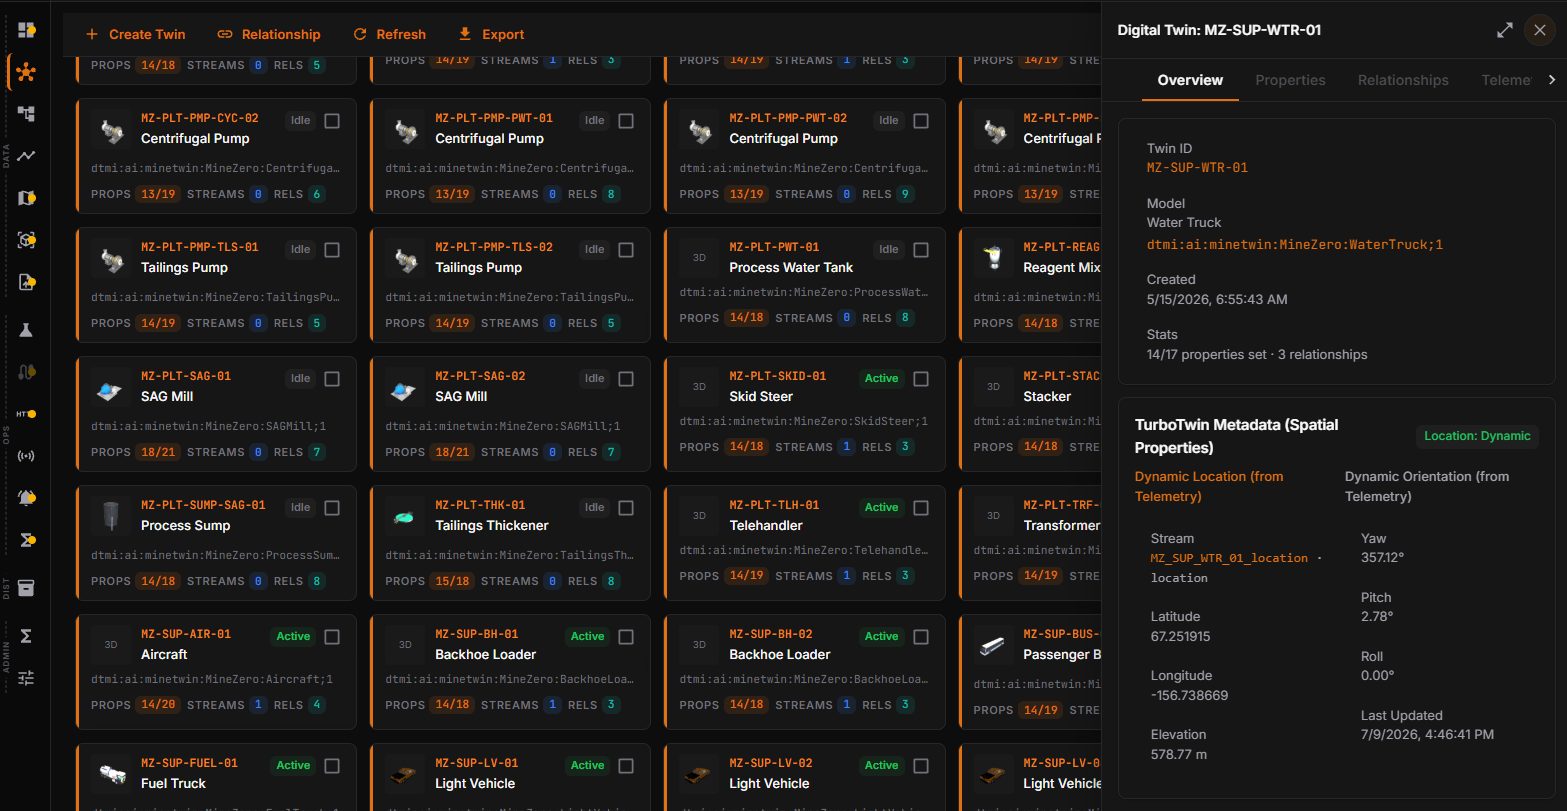
Placed, typed, and already reporting
The moment a twin exists it can carry telemetry, documents and relationships. The builder shows what is live, what is parked and what is waiting for a stream, so gaps in the data are visible on day one instead of in a review six months later.
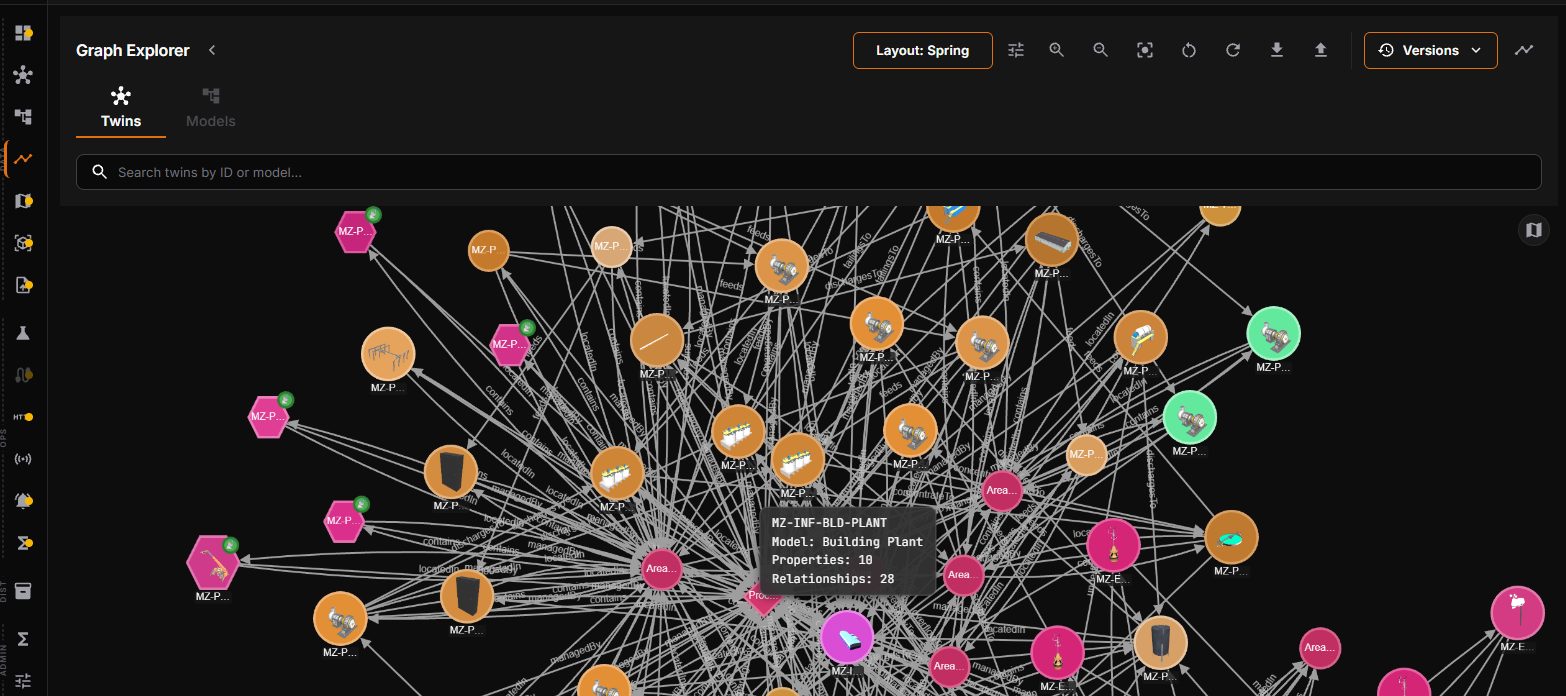
The site as a graph, not a folder tree
A twin is not a file in a folder. It is a node with typed relationships: this truck runs this circuit, is maintained under this plan, was operated by this person on this shift, and is described in this manual. The Expert Agent, the orientation editor and the 3D view all traverse the same graph, so an answer, a tour stop and a highlight are the same object seen three ways.
- Open interface definitions per asset class, extended per site
- Relationships are first-class and queryable
- Documents attach to the things they describe
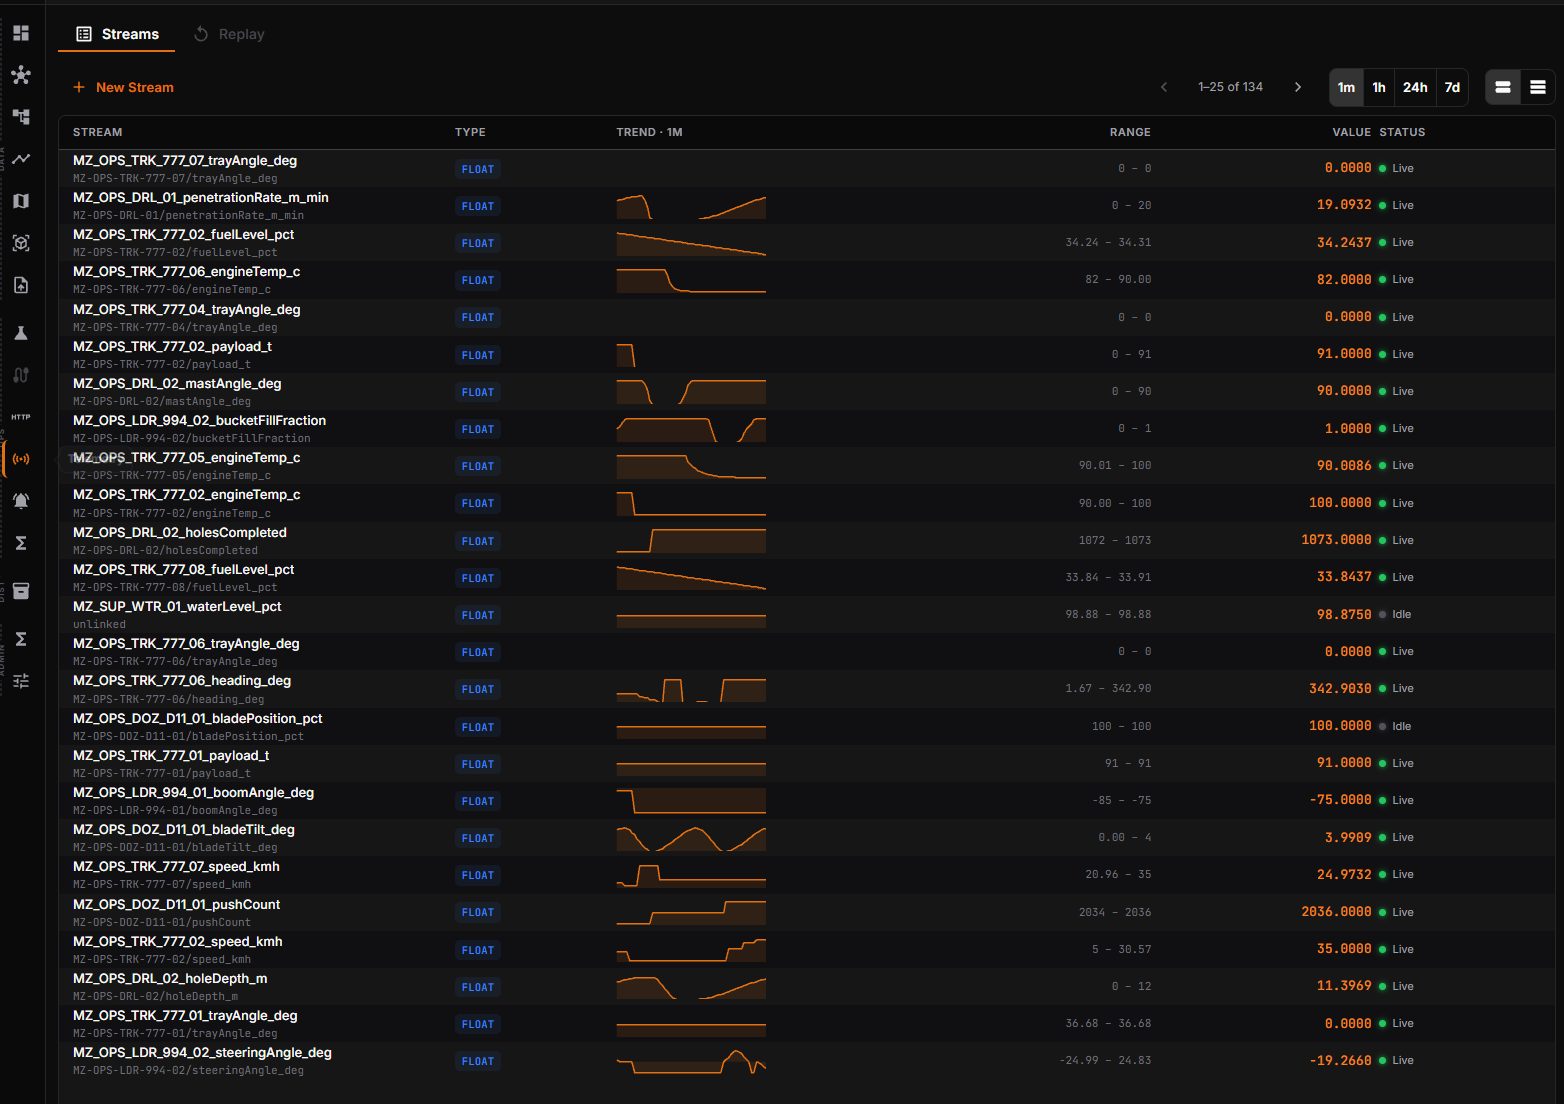
Live, typed, and attached to the thing that produced it
Every stream is typed, trended and bound to its twin: payload, fuel level, engine temperature, speed, drill penetration rate. Equipment is rigged with real joints, so a loader bucket, a truck tray or a drill boom moves from the per-joint telemetry the machine reports. The site looks alive because it is.
- 134 streams on the sandbox fleet, one-minute trends
- Rigged loaders, haul trucks, drills, water trucks and underground fleet
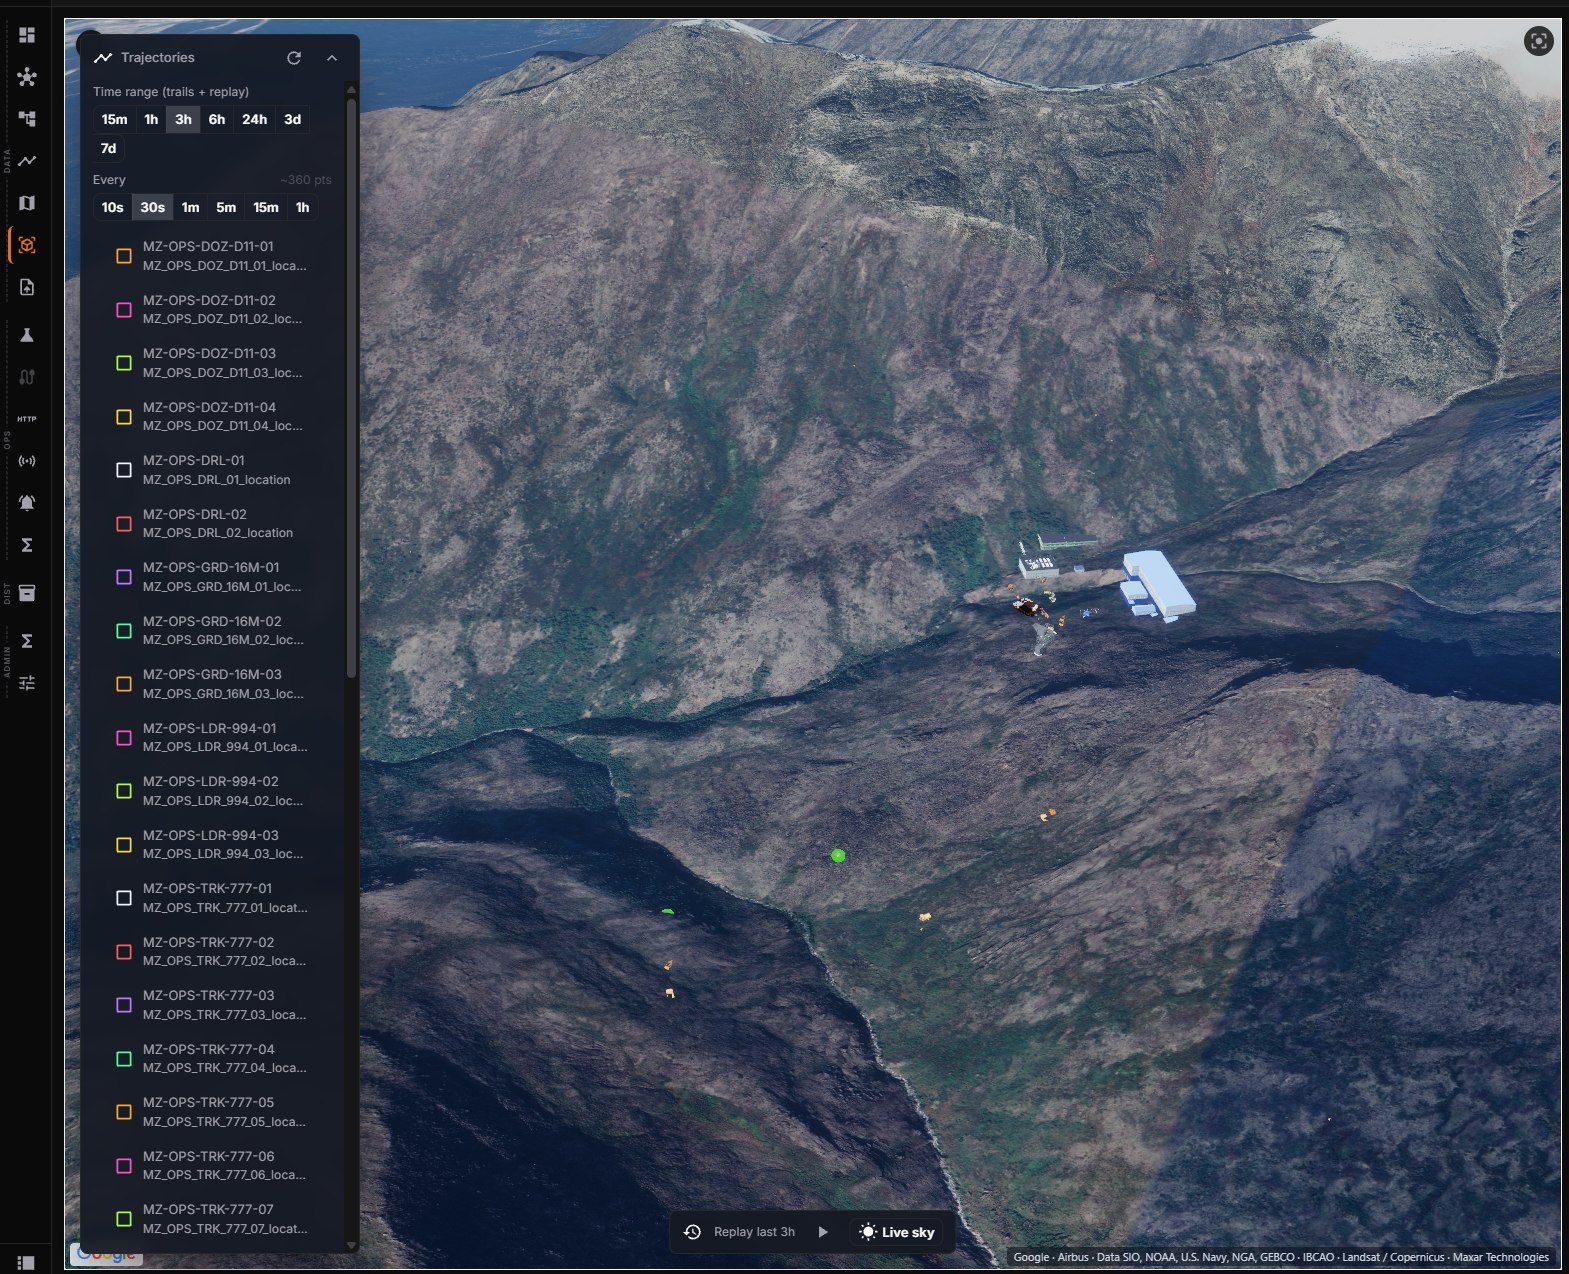
- Replay the whole site: rewind a shift and watch every trajectory
Rewind the whole site
Trajectories are stored with the twin, so a shift can be replayed as it happened: which truck went where, when the loader waited, where the water truck was when the road dried out. The same data feeds the simulator that tests a new circuit before it is built.
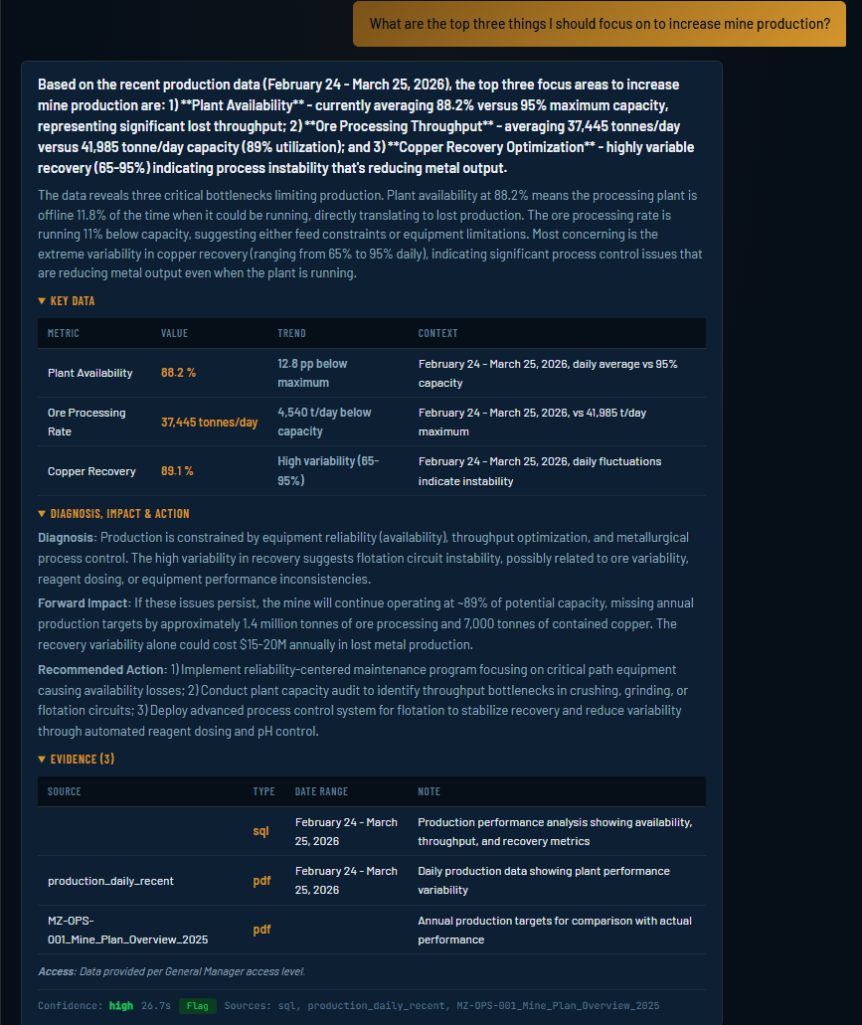
Ask the questions a 20-year operator would
The agent answers across fleet, maintenance, HR, safety and production data. It checks 21 verified pre-computed views first, which cover most common questions in under ten seconds. Anything else runs as a live query with the SQL shown. Every answer cites its sources and states its confidence. It never invents a number to fill a gap.
- Role-based access: a superintendent and a haul truck operator see different mines
- Answers carry the source tables and a confidence level
- Diagnosis, not just retrieval: recurring faults, cost drift, cycle-time creep
Author a site orientation the way you would storyboard it
Stops on a map, beats on a timeline: orbit, fly and look, highlight, narrate. Each stop references real twins, so when the plant changes the orientation follows. The trainee walks the site in 3D with a guide that knows their role, and the guide stays available after orientation ends.
- Visual editor over the real terrain and the live twin
- Role profiles: 9 profiles covering 150 or more job titles
- Four durations, completion logged, packages for the learning system you already use
Under the hood
Read-only connectors land raw site data in a Databricks lakehouse in your tenant. It is cleaned, typed and indexed, then structured into the graph that everything above runs on.
| Source | Examples | What the twin does with it |
|---|---|---|
| Fleet management | Cat MineStar, Wenco, Komatsu | Positions, cycles, payloads, alarms bound to each machine twin |
| Maintenance | SAP PM, IBM Maximo | Work orders, notifications and PM plans attached to the asset and its functional location |
| Enterprise hierarchy | SAP functional locations | Becomes the backbone of the graph; the plant tree is the twin tree |
| People | HR system, training records | Roles, crews, certifications; drives role-aware access and orientation |
| Environment and safety | Monitoring stations, incident systems | Limits and events placed where they happened |
| Documents | SOPs, safety plans, manuals | Embedded and attached to the twins they describe; 38 on the sandbox |
What it is not
Not a viewer with a database behind it. Not a replacement for your fleet, maintenance or HR systems. Not a model that has to be trained on your data before it is useful.
Where it runs
In your Azure tenant as a dedicated deployment operated by us, or hosted by MineTwin. Either way the integration is read-only and your source systems are untouched.
What it is built on
TurboTwin, a real-time spatial engine built for industrial environments, with Unreal Engine and web clients on the same twin. Databricks for the data layer.
Ask it about your mine.
A demo on the sandbox takes 30 minutes. A pilot on your own data takes 30 days.